Reading Travel + Leisure’s Loan Loss Ratio Against the SEC’s Complaint
- Published
- October 21, 2026
- Reading time
- 18 min
On September 30, 2026, the Securities and Exchange Commission filed a settled civil action in the Southern District of Florida against Travel + Leisure Co., which reported as Wyndham Destinations, Inc., during nearly all of the period at issue.¹ ² The complaint alleges that from October 2019 through February 2021, the Company made misstatements and omissions about two undisclosed projects “in which it rescinded thousands of customer timeshare loans that were already seriously past due or in default.”¹ According to the complaint, from May 2019 to at least December 2020, the Company rescinded more than 2,900 delinquent or defaulted loans through the two projects, “totaling about $77 million in loan balances, including roughly $34 million of defaulted loans,” and every one of those rescissions came after the statutory rescission period that state law typically gives consumers had run.¹ The Commission alleges violations of Sections 17(a)(2) and 17(a)(3) of the Securities Act and of Section 13(a) of the Exchange Act and the reporting rules under it.¹ Without admitting the allegations, the Company consented to a final judgment, subject to court approval, that would permanently enjoin it from violating those provisions and order it to pay a civil penalty of $975,000.²
The measure at the center of the complaint is one the Company defined and published itself: the provision for loan losses as a percentage of gross vacation ownership interest sales, net of fee-for-service sales.¹ ⁵ The complaint calls it the Loan Loss Provision Percentage. It alleges that the rescissions “materially improved” that figure and the provision itself “for several fiscal quarters in 2019 and 2020,” that the Company “never tracked the actual impact of the Projects and never told investors about the Projects,” and that, when asked on earnings calls why the percentage had improved, the Company “credited changes like customer-care initiatives, stricter underwriting, or operational improvements.”¹ Two of the complaint’s allegations state what a reported figure would have shown without the projects. It says that without the projects the 20.3 percent reported for the third quarter of 2019 “would not have improved compared to the prior year,” and that the full-year figure for 2019, which the Company called flat, “would not have met guidance.”¹
The complaint gives no counterfactual figures, and the Company’s releases give no figures for the rescissions. What the public record does contain is the definition of the ratio, the dollar amounts on each side of it for every quarter, and the guidance the Company gave for it. Read together with the complaint, those documents show how many dollars of provision a tenth of a point represented, which sides of the fraction the complaint says a late rescission touched, and what questions a lender, a noteholder, or a director can ask about any credit ratio a company defines for itself.
The ratio as the Company defined it
The numerator is the provision for loan losses. Each release for the 2019 quarters described it in a footnote to its table of operating statistics, in the words of the first: “Represents provision for estimated losses on vacation ownership contract receivables originated during the period, which is recorded as a contra revenue to vacation ownership interest sales on the Consolidated Statements of Income.”³ ⁴ ⁵ ⁶ The Company’s quarterly report for the third quarter of 2019 describes the same entry from the revenue side. For developer-financed sales, it says, the Company reduces the transaction price “by an estimate of uncollectible consideration at the time of the sale,” and its estimates of uncollectible amounts “are based largely on the results of the Company’s static pool analysis which relies on historical payment data by customer class.”⁹ The complaint describes the provision in plainer terms, as an amount of revenue the Company holds back at the time of sale because it knows some customers will not repay their loans in full, “essentially functioning as a built-in adjustment that accounts for estimated losses.”¹
The denominator is gross sales of vacation ownership interests, less sales made under the Company’s fee-for-service arrangements. The annual report for 2019 defines gross VOI sales as “Sales of VOIs including Fee-for-Service sales, before the effect of loan loss provisions.”⁸ In 2019, fee-for-service sales were $28 million of $2,355 million in gross sales for the year.⁶ In this article, “net sales” means this denominator, gross VOI sales net of fee-for-service sales. The figure the Company labels net VOI sales is a different one, stated after the provision.
Two features of the definition matter for what follows. The first is that the denominator is a sales figure, not a portfolio figure. The ratio measures how much the Company reserved against what it sold in a period, and it says nothing directly about the $3,867 million of gross contract receivables the Company carried at the end of 2019.⁸ The second concerns defaults. The Company’s accounting policies state that it writes a contract receivable off to the allowance for loan losses once it has been delinquent for more than 120 days, and that it assesses the allowance on a static pool basis, so that individual loans are not assessed for impairment apart from their pool.⁸ The policies opened for this article describe write-offs against the allowance and estimates set at the time of sale. They do not say how, or whether, estimates on loans sold in earlier periods are revised through the provision, and the first quarter of 2020, discussed below, shows that the provision line can carry a charge on the existing portfolio.⁷ ⁸ ⁹
What the releases reported in 2019
The guidance came with the Company’s report for the first quarter of 2019. The release issued on May 1, 2019, put the provision at 22.5 percent of net sales for the quarter, against 20.4 percent a year earlier, and gave the outlook for the full year as “comparable to 2018, which was 20.5%.”³ The complaint says that on the earnings call that day, five analysts asked about the figure, and that management told them it would stop the trend of year-over-year increases and achieve the 2019 guidance.¹ It describes the year-over-year increase in the first quarter as “just over 2%.”¹ In the release’s own figures, the increase was 2.1 percentage points.³
The complaint places the start of the first project, which it calls the Special Handling Project, in May 2019, and the start of the second, the PastDue Project, in August 2019.¹ The releases for the next three quarters each reported a year-over-year improvement. The second quarter came in at 21.2 percent, against 21.4 percent.⁴ The third quarter, reported on October 30, 2019, came in at 20.3 percent, against 20.8 percent, and the release reaffirmed the outlook for the year.⁵ The fourth quarter, reported on February 26, 2020, came in at 18.6 percent, against 19.3 percent, and the same release gave the full year: “For the full-year of 2019, the provision percentage was 20.6%, flat compared to 2018.”⁶ The full-year figure for 2018 shown in that release was 20.5 percent.⁶ The release also gave an outlook for 2020 of “around 20%.”⁶
The release for the first quarter of 2020, issued on May 6, 2020, recorded a provision charge of $225 million “in anticipation of increased defaults due to the impact of COVID-19,” showed the ratio for the quarter as not meaningful, and said that excluding that charge the ratio “showed improvement and would have been the fourth quarter in a row of consecutive year-over-year improvement for that metric.”⁷ The complaint treats that sentence as one of the misleading statements it identifies, together with the third-quarter and full-year statements for 2019.¹
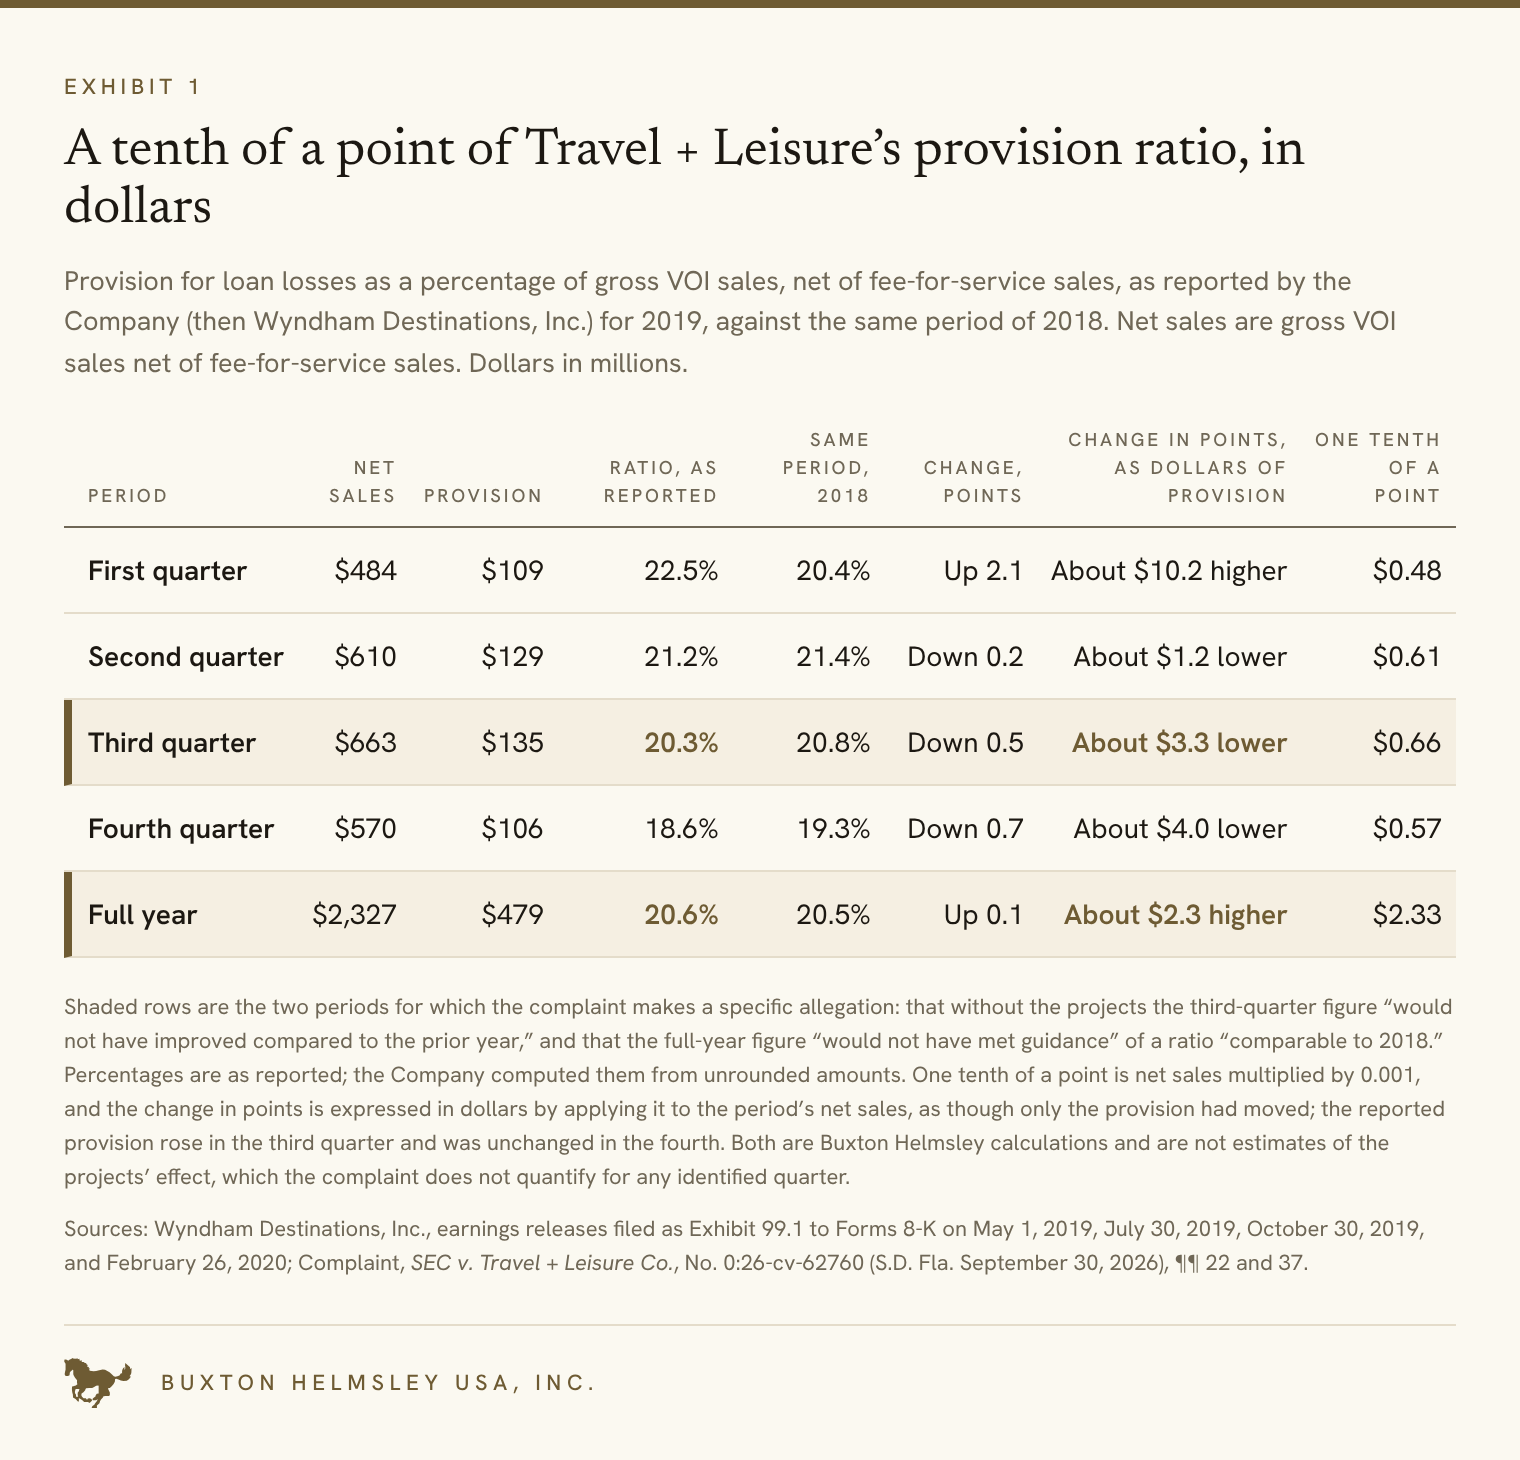
Exhibit 1 sets out the quarters of 2018 and 2019 from the releases.
Exhibit 1. A tenth of a point of Travel + Leisure’s provision ratio, in dollars
What a tenth of a point was worth
The ratio is reported to one decimal place, and at the scale of the Company’s sales a tenth of a point was well under a million dollars in a quarter. Net sales of $663 million in the third quarter of 2019 put one tenth of a point at about $0.66 million of provision.¹⁰ For the full year, net sales of $2,327 million put it at about $2.3 million, against a full-year provision of $479 million.⁶ ¹⁰
Measured that way, the improvement the Company reported for the third quarter of 2019, half a percentage point, was equivalent to about $3.3 million of provision on that quarter’s sales.¹⁰ The fourth-quarter improvement of 0.7 points was equivalent to about $4.0 million, and the second-quarter improvement of 0.2 points to about $1.2 million.¹⁰ The increase of 2.1 points in the first quarter, the one the complaint says drew questions from five analysts, was equivalent to about $10.2 million.¹ ¹⁰ The full-year difference between 20.6 percent and 20.5 percent, which the February 2020 release described as flat, was equivalent to about $2.3 million.⁶ ¹⁰
Those are equivalents, not estimates of anything the projects did. The complaint does not quantify the effect of the projects for any identified quarter. It says that in several quarters the projects improved the provision and the percentage “by more than five percent,” without saying whether that is measured in percentage points or as a share of the reported figure, and without naming the quarters, and it refers to “these estimated impacts” without giving them.¹ Its third-quarter allegation can be read for what it implies. If the ratio would not have improved from 20.8 percent without the projects, their effect in that quarter was at least roughly the improvement the Company reported: a minimum of somewhere between 0.4 and 0.6 points once the rounding of the reported figures is allowed for, with no upper limit stated.¹ ⁵ ¹⁰ At that quarter’s sales, half a point is equivalent to about $3.3 million of provision, but only if the entries fell on the provision side alone, and the complaint says the reversals also undid sale revenue.¹ ¹⁰ The complaint gives no figure, and this article does not supply one.
The full-year allegation cannot be converted into a number at all. The guidance was that the ratio would be “comparable to 2018,” and none of the releases says how far from 20.5 percent a comparable figure could be.³ ⁴ ⁵ ⁶ The complaint says that, without the projects, the Company “would not have met guidance,” which places the counterfactual figure outside a band the public record never defined.¹ The complaint also states how the internal targets for the first project were built: they were “calculated by determining how many defaults Travel + Leisure had to remove to meet its 2019 guidance and its internal 2020 goals,” and senior management agreed on them at least quarterly.¹ The documents opened for this article do not give any of those targets.
The totals the complaint gives are balances, not provision, and they are not broken down by period. On its account, the projects removed about $77 million of loan balances between May 2019 and at least December 2020, including about $34 million of defaulted loans.¹ The complaint says that about 44 percent of the rescinded contracts were at least a year old when they were rescinded, and about 11 percent more than two years old.¹ How much of the $77 million reached the provision in any given quarter is a question the documents do not answer, and the answer would depend on the accounting described in the next section.
What a late rescission touched
The complaint describes the entries in one paragraph. Once the Company decided to rescind contracts under either project, “it reversed them in its accounting system as if the loans had never been made.”¹ For the loans involved, it continues, “that meant undoing the original revenue from the sale, undoing the Loan Loss Provision it had previously recorded, and reversing the defaulted amounts for loans that were defaulted at the time of rescission.”¹ A later paragraph says that, when the Company rescinded contracts months or years after the original sale, it reversed the revenue and related entries, “effectively treating the loans as though the original sales and resulting receivables had never been part of its loan portfolio.”¹
That description names three things. Two of them are the inputs to the ratio: sale revenue, which is the basis of the denominator, and provision, which is the numerator. The third, defaulted amounts, appears to correspond to what the Company’s policies write off to the allowance after 120 days, since the complaint treats a loan as defaulted at more than 120 days past due, the same point at which the policies write a receivable off.¹ ⁸ The complaint does not say in which period’s reported figures each reversal landed, or how much of each it removed.
A ratio of this kind does not move when equal shares come off both sides. Take a period with $100 of net sales and $20 of provision, a ratio of 20 percent (an illustration, not the Company’s figures). Reverse a sale of $10 that carried a provision of $2, and the period shows $90 and $18, still 20 percent. The ratio falls only if the reversal takes out a larger share of the provision than of the sales, or if something else lowers the provision rate applied to the sales that remain. Reverse the same $10 sale together with $5 of provision, and the period shows $90 and $15, or 16.7 percent.
The documents do not show which of those possibilities applied. The Company’s quarterly report says its estimates of uncollectible amounts rest largely on static pool analysis, which “relies on historical payment data by customer class.”⁹ The complaint describes the first project’s targets in terms of defaults removed, but it does not say in which periods, or in what amounts, the reversals reached the ratio.¹ The filings opened for this article do not describe how the Company’s static pools treated a contract reversed after the rescission period. That is a question the Company’s accounting records could answer and its public filings, as reviewed here, do not.
The same year in the annual report
The annual report for 2019 contains the measures a reader would turn to after the ratio. The allowance for loan losses on contract receivables began the year at $734 million, was increased by the $479 million provision, was reduced by $466 million of contract receivables written off, net, and ended the year at $747 million.⁸ ¹⁰ Net write-offs had been $350 million in 2017 and $413 million in 2018, against provisions of $420 million and $456 million.⁸ At the end of 2019, the allowance was about 19.3 percent of gross contract receivables, against about 19.5 percent a year earlier.⁸ ¹⁰
The two sets of figures answer different questions. Under the 120-day policy, write-offs in a year would mostly reflect loans sold in earlier years that passed 120 days past due during that year, and the provision reflects the estimate for loans sold during the year. Write-offs rose faster than the provision in 2018, before either project began, as well as in 2019, so the pairing by itself shows nothing about the projects.⁸ ¹⁰ A reader who looks only at the ratio sees neither figure, and both are in the same filing.
The complaint adds a qualification that applies to every figure in this section. On its account, the reversals reached defaulted amounts as well as provision and revenue, so net write-offs, the allowance, and the receivables balance were all within reach of the same entries.¹ The complaint does not allocate the $77 million among them. If that account is right, the allowance, the write-offs, and the receivables balance would not have been independent of the ratio in those periods, and they can serve as a check on it only so far.
What the documents do not show
The complaint does not name any officer, and it refers to the speakers on the third-quarter 2019 call only as “senior officers.”¹ It does not give the 2020 internal goals, the monthly targets, or the effect of the projects for any identified quarter. It does not say whether any rescinded loan would have been collected. It alleges that the Company never tracked the actual impact of the projects.¹
The litigation release describes the final judgment as subject to court approval.² This article relies on the complaint for every statement about the projects, and every such statement is an allegation that the Company has neither admitted nor been found by a court to be true. The Company’s annual report for 2019 is cited here for its definitions, its policies, and its tables. This article does not quote the Company’s Management’s Discussion and Analysis for 2019, where the complaint says misleading statements appeared.¹ ⁸
The complaint also identifies the securities the Company issued while the statements it challenges were outstanding. It says that during the relevant period the Company raised about $1.65 billion through three private offerings of notes, issued $13.5 million of common stock for an acquisition in 2019, and issued $96.8 million of common stock through its employee stock purchase plan, and it alleges that those offerings incorporated Commission filings it describes as misleading.¹
Questions to ask of a ratio a company defines for itself
The complaint does not take issue with the definition of the ratio. Its allegations concern entries that, on its account, moved the ratio without being disclosed, and nothing in the definition would have shown them to a reader. Any credit ratio a company builds from its own entries can be moved by entries its definition does not mention. A lender, a noteholder, or a director looking at one can work through five questions.
The first is to write the formula out in the company’s own words, both sides, and to note what kind of quantity the denominator is. Here, it was a period’s sales, so the ratio described the reserve set against new business and said nothing directly about the portfolio already on the books. A reader who takes such a ratio as a measure of portfolio health is reading it for something it does not measure.
The second is to compute what a tenth of a point is worth in dollars in each period, and to set that figure against the reported changes and against the guidance. At Travel + Leisure in 2019, a tenth of a point was about $2.3 million on a year of sales, a reported improvement of half a point in a quarter was about $3.3 million, and the guidance was a word, “comparable,” with no stated band.³ ⁵ ¹⁰ When the reported changes run from about $1 million to about $10 million of provision, and the guidance has no numeric limit, a reader should know which entries other than ordinary reserving can move the ratio by that much.
The third is to list those entries and ask for them. On the complaint’s account, rescissions after the statutory period reached revenue, the provision, and defaulted amounts, and a reader can ask whether cancellations, sales reversals, or contract modifications reach any of them as well.¹ A request for the count and the balance of contracts reversed after the statutory rescission period, by quarter, with the effect on the provision and on net write-offs, is specific enough to answer and would have covered the activity the complaint describes.
The fourth is to read the ratio alongside the allowance rollforward, the write-offs, and the aging of the receivables, in the same filing, knowing that a reversal can reach those lines too. A divergence among them, such as write-offs rising faster than the provision, is not a finding. It is the place to begin asking.
The fifth is to ask, when management explains a change in the ratio, whether the factors it names were measured, and what share of the change each accounted for. The complaint alleges that, on certain earnings calls, the Company credited changes such as customer-care initiatives, stricter underwriting, or operational improvements, and that the Company never tracked the effect of the projects.¹ An explanation that cannot be broken down into amounts is one a reader can decline to rely on until it is.
Each of these questions can be put from the public filings, before any conversation with management, and the first two can be answered from them.
Related reading
Optimum’s Rate Reconciliation Treated a Franchise Impairment the Way It Treated Goodwill
The SEC Would Stop Asking Whether a Private Fund’s Auditor Is Subject to PCAOB Inspection
The Repurchase Safe Harbor and a Trading Day That Begins the Night Before
Referenced Sources:
[1] Complaint, Securities and Exchange Commission v. Travel + Leisure Co., No. 0:26-cv-62760 (S.D. Fla. filed September 30, 2026), https://www.sec.gov/files/litigation/complaints/2026/comp26657.pdf (primary; ¶ 1 supports the relevant period, the quoted description of the rescissions, and the definitions of the Loan Loss Provision and the Loan Loss Provision Percentage; ¶ 5 also supports the statement that every rescission came after the statutory rescission period; ¶ 18 supports the definition of a defaulted loan as more than 120 days past due; ¶¶ 3 and 25 to 31 support the names and start dates of the two projects and the construction of the targets, including the quoted language of ¶ 28; ¶¶ 5 and 24 support the number, balances, and ages of the rescinded loans and the quoted language on balances and on the treatment of the loans as though they had never been part of the portfolio; ¶ 6 supports the quoted description of the reversing entries; ¶ 7 supports the quoted allegations on improvement, tracking, and the explanations given on earnings calls; ¶¶ 11 and 15 support the Company’s former names; ¶ 17 supports the quoted description of the provision; ¶ 22 supports the first-quarter 2019 call and guidance and the quoted “just over 2%”; ¶ 35 supports the quoted “by more than five percent” and the statements identified as misleading; ¶ 36 supports the explanations attributed to “senior officers” on the third-quarter 2019 call; ¶ 37 supports the quoted allegations on the third quarter of 2019, the full year 2019, and the first quarter of 2020; ¶ 39 supports the offerings of notes and stock; ¶¶ 40 to 50 support the provisions alleged to have been violated). The complaint’s allegations have not been admitted by the Company or adjudicated.
[2] U.S. Securities and Exchange Commission, Litigation Release No. 26657 and Accounting and Auditing Enforcement No. 4603, “SEC Files Settled Action Against Travel + Leisure Co. in Connection with Alleged Misleading Disclosures Concerning Certain Performance Measures for its Timeshare Loan Portfolio” (September 30, 2026), https://www.sec.gov/enforcement-litigation/litigation-releases/lr-26657 (primary; supports the filing of the settled action, the statement that the Company consented without admitting the allegations, the final judgment subject to court approval, the injunction, and the civil penalty of $975,000).
[3] Wyndham Destinations, Inc., earnings release for the first quarter of 2019, Exhibit 99.1 to Current Report on Form 8-K, May 1, 2019, https://www.sec.gov/Archives/edgar/data/1361658/000136165819000059/wynd1q2019earningsrelease.htm (primary; supports the ratio of 22.5 percent for the first quarter of 2019 and 20.4 percent for the first quarter of 2018, the quoted outlook for 2019, the quoted footnote describing the provision, and the net sales and provision for both quarters).
[4] Wyndham Destinations, Inc., earnings release for the second quarter of 2019, Exhibit 99.1 to Current Report on Form 8-K, July 30, 2019, https://www.sec.gov/Archives/edgar/data/1361658/000136165819000135/wynd2q2019earningsrelease.htm (primary; supports the ratios of 21.2 percent and 21.4 percent, the outlook for 2019, the footnote describing the provision, and the net sales and provision for both quarters).
[5] Wyndham Destinations, Inc., earnings release for the third quarter of 2019, Exhibit 99.1 to Current Report on Form 8-K, October 30, 2019, https://www.sec.gov/Archives/edgar/data/1361658/000136165819000168/wynd3q2019earningsrele.htm (primary; supports the definition of the ratio as stated in the release, the ratios of 20.3 percent and 20.8 percent, the reaffirmed outlook “to be comparable to 2018, which was 20.5%,” the footnote describing the provision in substantially the same words as the other releases, and the net sales and provision for both quarters).
[6] Wyndham Destinations, Inc., earnings release for the fourth quarter and full year 2019, Exhibit 99.1 to Current Report on Form 8-K, February 26, 2020, https://www.sec.gov/Archives/edgar/data/1361658/000136165820000010/wynd4q2019earningsrele.htm (primary; supports the ratios of 18.6 percent and 19.3 percent for the fourth quarters of 2019 and 2018, the quoted full-year statement, the full-year ratios of 20.6 percent and 20.5 percent, the quoted outlook for 2020, the footnote describing the provision, gross VOI sales of $2,355 million and fee-for-service sales of $28 million for 2019, and the net sales and provision for each period).
[7] Wyndham Destinations, Inc., earnings release for the first quarter of 2020, Exhibit 99.1 to Current Report on Form 8-K, May 6, 2020, https://www.sec.gov/Archives/edgar/data/1361658/000136165820000100/wynd1q20earningsrelease.htm (primary; supports the provision charge of $225 million and the quoted language on it, the ratio shown as not meaningful, and the quoted statement on the ratio excluding the charge).
[8] Wyndham Destinations, Inc., Annual Report on Form 10-K for the fiscal year ended December 31, 2019, filed February 26, 2020, https://www.sec.gov/Archives/edgar/data/0001361658/000136165820000012/wynd-20191231x10k.htm, Item 1, Vacation Ownership, “Revenues and Operating Statistics” (primary; supports the quoted definition of gross VOI sales); Summary of Significant Accounting Policies, “Credit Quality for Financed Receivables and the Allowance for Credit Losses,” and the note on Vacation Ownership Contract Receivables, as presented in the filing’s interactive data (supports the write-off of contract receivables to the allowance for loan losses after more than 120 days of delinquency, the static pool methodology, gross contract receivables of $3,867 million and $3,771 million, the allowance for loan losses of $747 million and $734 million, and the provision of $479 million and $456 million and net write-offs of $466 million and $413 million for 2019 and 2018, and $420 million and $350 million for 2017).
[9] Wyndham Destinations, Inc., Quarterly Report on Form 10-Q for the quarterly period ended September 30, 2019, https://www.sec.gov/Archives/edgar/data/1361658/000136165819000171/wynd-2019930x10q.htm, Note 3, Revenue Recognition (primary; supports the quoted statements on the reduction of the transaction price for developer-financed sales and on static pool analysis).
[10] Buxton Helmsley calculations, derived and not reported by the Company. One tenth of a percentage point equals net sales multiplied by 0.001: $663 million gives $0.663 million for the third quarter of 2019, and $2,327 million gives $2.327 million for the full year. The dollar equivalents of the reported year-over-year changes are the change in percentage points multiplied by the period’s net sales: 0.5 points of $663 million is $3.3 million; 0.7 points of $570 million is $4.0 million; 0.2 points of $610 million is $1.2 million; 2.1 points of $484 million is $10.2 million; and 0.1 points of $2,327 million is $2.3 million. The allowance rollforward is $734 million plus $479 million less $466 million, or $747 million. Net write-offs rose from $350 million to $413 million, or 18.0 percent, in 2018, while the provision rose from $420 million to $456 million, or 8.6 percent; in 2019, net write-offs rose to $466 million, or 12.8 percent, and the provision to $479 million, or 5.0 percent. The allowance was $747 million of $3,867 million, or 19.3 percent, at the end of 2019, and $734 million of $3,771 million, or 19.5 percent, at the end of 2018. Ratios computed from the rounded figures in the releases differ from the reported ratios by up to about a tenth of a point; for example, $135 million of $663 million is 20.36 percent, which rounds to 20.4 percent, against the 20.3 percent reported for the third quarter of 2019, and $132 million of $635 million is 20.79 percent, so the rounded table figures give a gap of 0.43 points; reported figures of 20.3 percent and 20.8 percent, each rounded to a tenth, are consistent with a gap of between 0.4 and 0.6 points. The numerical illustration of a reversal is Buxton Helmsley’s and does not use the Company’s figures.
This publication is one of the Insights commentaries of Buxton Helmsley USA, Inc. (“Buxton Helmsley”). It reflects the opinions, analysis, and interpretations of Buxton Helmsley as of the date of publication, and it is based upon information that Buxton Helmsley believes to be accurate and that is derived from public sources or from other sources believed to be reliable. Buxton Helmsley does not represent or warrant that such information is accurate or complete, and it should not be relied upon as such. The views expressed are subject to change at any time, and Buxton Helmsley undertakes no obligation to update this publication or to correct any information contained within it.
Except for statements expressly attributed to an identified source or to a public filing, the statements in this publication constitute the opinions and good-faith analysis of Buxton Helmsley and are not statements of objective fact. Buxton Helmsley’s analysis may rest upon assumptions, estimates, and interpretations that could prove to be incorrect. Any reference to a potential violation, misstatement, impropriety, or deficiency reflects Buxton Helmsley’s analytical conclusions and opinions, and does not represent a finding by any court, regulator, or other authority. Readers should conduct their own investigation and analysis of any company, security, or matter discussed. Any company or person referenced that believes any statement in this publication to be inaccurate is invited to contact Buxton Helmsley at general@buxtonhelmsley.com, and Buxton Helmsley will give good-faith consideration to any correction supported by credible evidence.
This publication is provided for informational purposes only. It does not constitute, and should not be construed as, investment advice, a recommendation, or the provision of any individualized investment advisory service to any person, nor an offer or solicitation to buy, sell, or hold any security. Nothing in this publication takes into account the particular investment objectives, financial situation, or needs of any reader. No reader should construe this publication as creating any advisory, fiduciary, or other relationship between Buxton Helmsley and such reader. Readers should consult their own legal, tax, accounting, and financial advisers before making any investment decision.
As of the date of this publication, Buxton Helmsley, the funds and accounts that it manages or advises, and its principals hold no position in the securities of the companies mentioned in the article. Buxton Helmsley and the foregoing persons may, at any time and without further notice, purchase, sell, cover, or otherwise change any position in any security discussed in this publication, including in a manner inconsistent with the opinions expressed herein, for various reasons, including but not limited to new research discoveries. Buxton Helmsley may realize gains in the event that the price of any security discussed moves in a direction consistent with a position that it holds.
Buxton Helmsley has not received, and will not receive, any compensation from any third party—including any issuer discussed in this publication or any person holding an interest in any such issuer—in connection with the preparation or publication of this commentary, except as expressly disclosed in this publication. Buxton Helmsley was not engaged or compensated by any third party to publish this commentary, except as expressly disclosed in this publication.
This publication is not, and shall not be construed as, an offer to sell or a solicitation of an offer to buy any security or any interest in any fund or other investment vehicle managed or advised by Buxton Helmsley or any of its affiliates, nor is it an advertisement for any such fund, vehicle, or advisory service. Any such offer or solicitation will be made only by means of definitive offering documents, and only to eligible investors, in accordance with applicable law.
This publication is intended only for distribution to, and use by, persons in the United States. It is not directed to, intended for, or to be relied upon by, any person located in any jurisdiction outside the United States, and it does not constitute an offer, solicitation, or provision of any service in any such jurisdiction. Persons who access this publication from outside the United States do so on their own initiative and are responsible for compliance with the laws applicable to them.
This publication may contain forward-looking statements that reflect Buxton Helmsley’s current expectations and that are subject to risks and uncertainties that could cause actual results to differ materially from those expressed. Past performance is not indicative of, and does not guarantee, future results. No representation is made that any investment will achieve, or is likely to achieve, results comparable to those discussed.
To the fullest extent permitted by applicable law, neither Buxton Helmsley nor any of its affiliates, nor their respective principals, members, officers, employees, or agents, shall have any liability to any person for any direct, indirect, incidental, consequential, or other loss or damage arising from any use of, or reliance upon, this publication or any information contained within it.
If any provision of these disclosures is held to be invalid or unenforceable, the remaining provisions shall continue in full force and effect.
© 2026 Buxton Helmsley USA, Inc. All rights reserved. This publication may not be reproduced or redistributed, in whole or in part, without attribution to Buxton Helmsley.